Posts
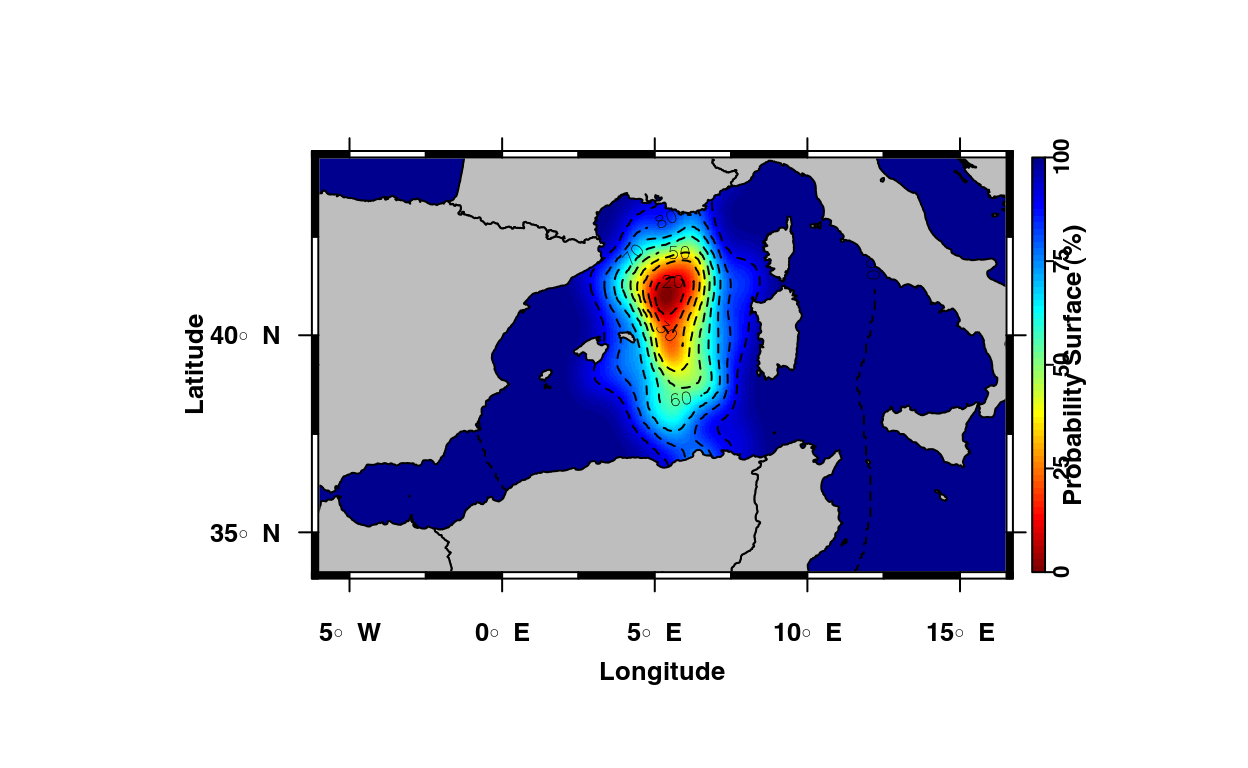
RchivalTag Tutorial | Part 8 - Spatial Analyses
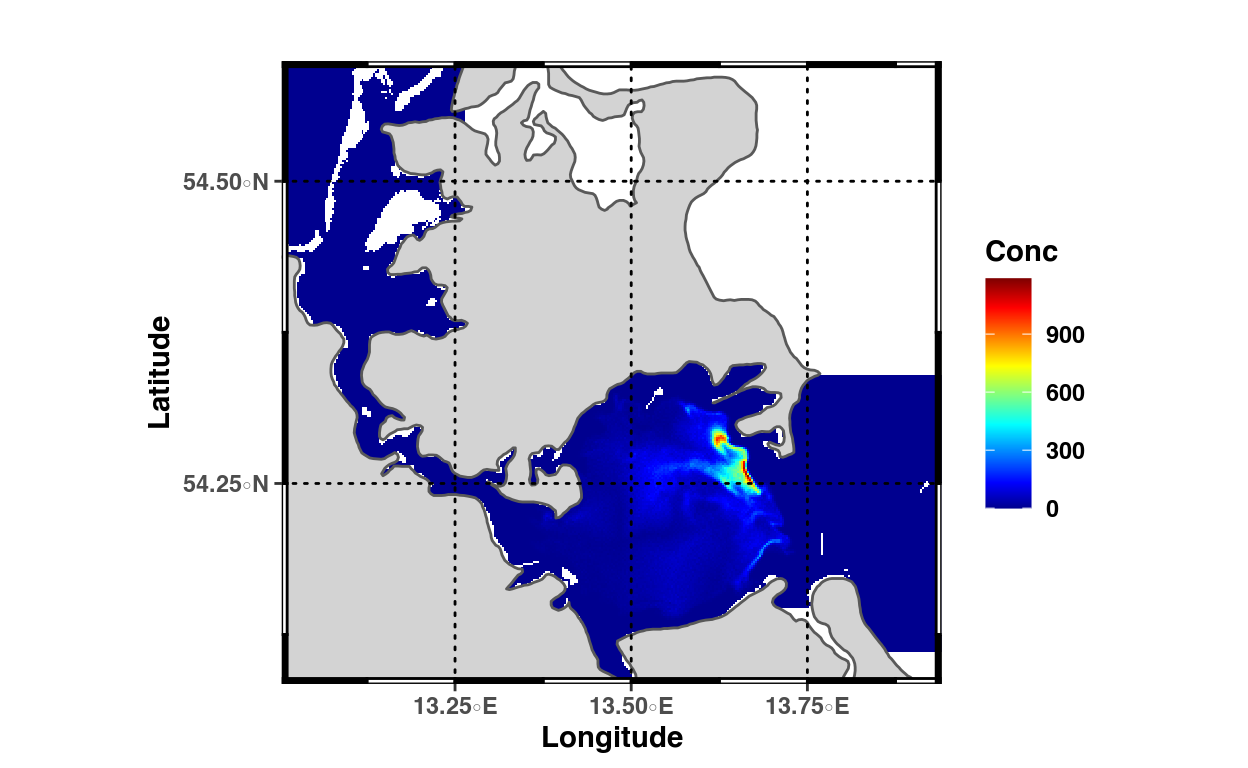
In this tutorial we will learn how to run some basic spatial analyses based on maximum likelihood tracks, probability surfaces and simulated fishing effort data (kernel densities).
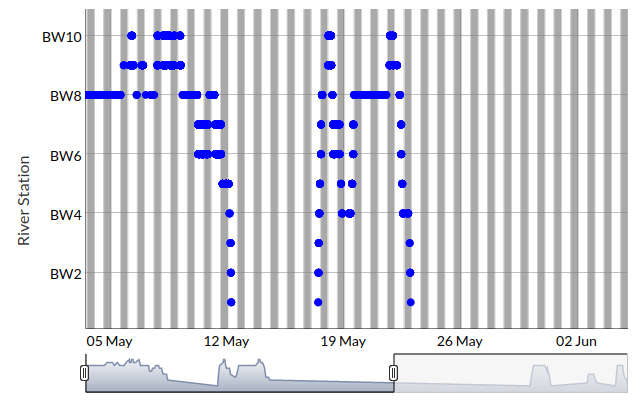
Interactive Acoustic/Radiotelemtry Data Abacus Plots
This tutorial illustrates how to create an abacus plot from raw acoustic detections from and array of several Vemco VR2W acoustic receivers.
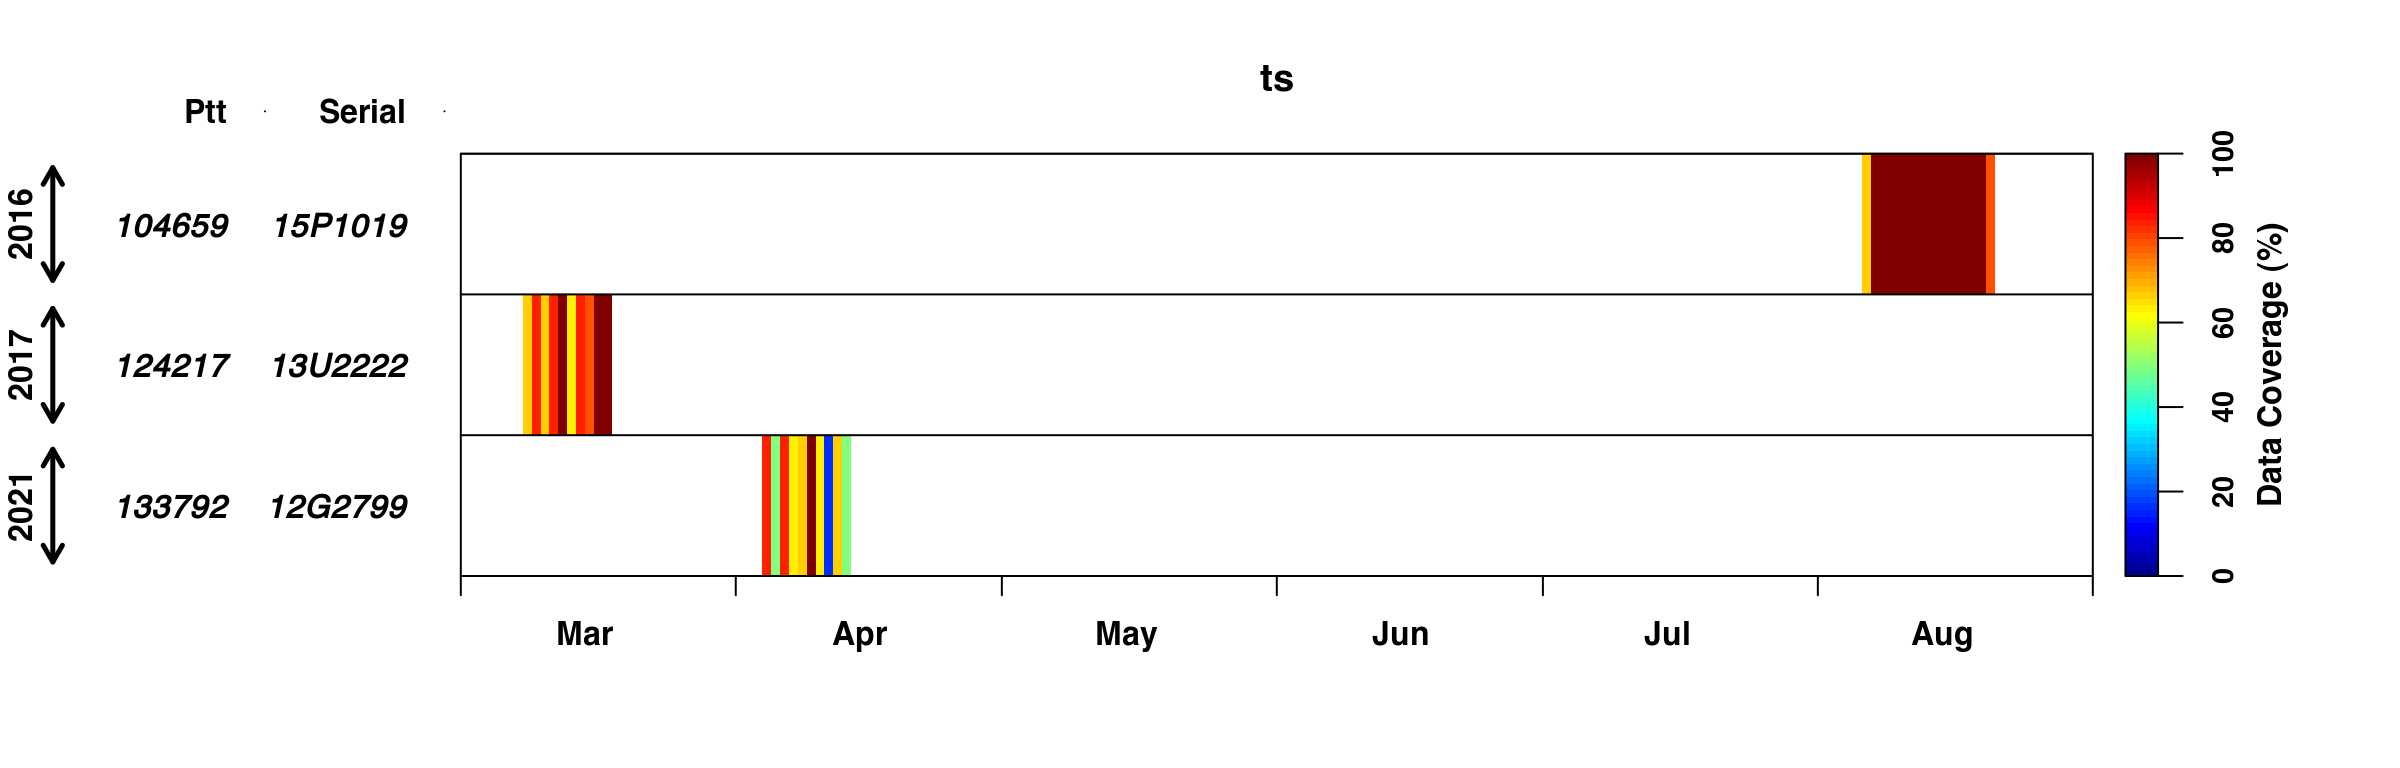
RchivalTag Tutorial | Part 7 - Simulate Depth Time Series Data
In this tutorial we will learn how to simulate depth time series data from a template data set.
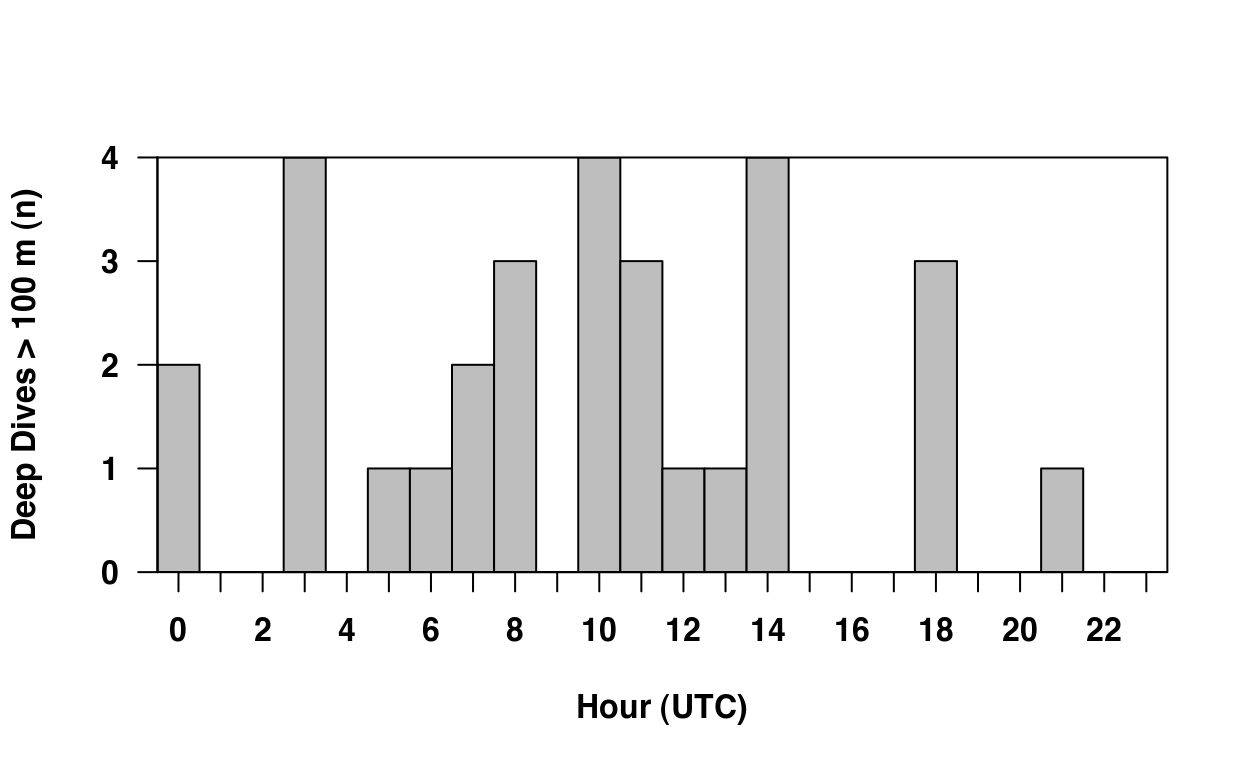
RchivalTag Tutorial | Part 6 - Quantifying Deep Dives
In this tutorial we will learn how to quantify deep dives from depth temperature time series data.
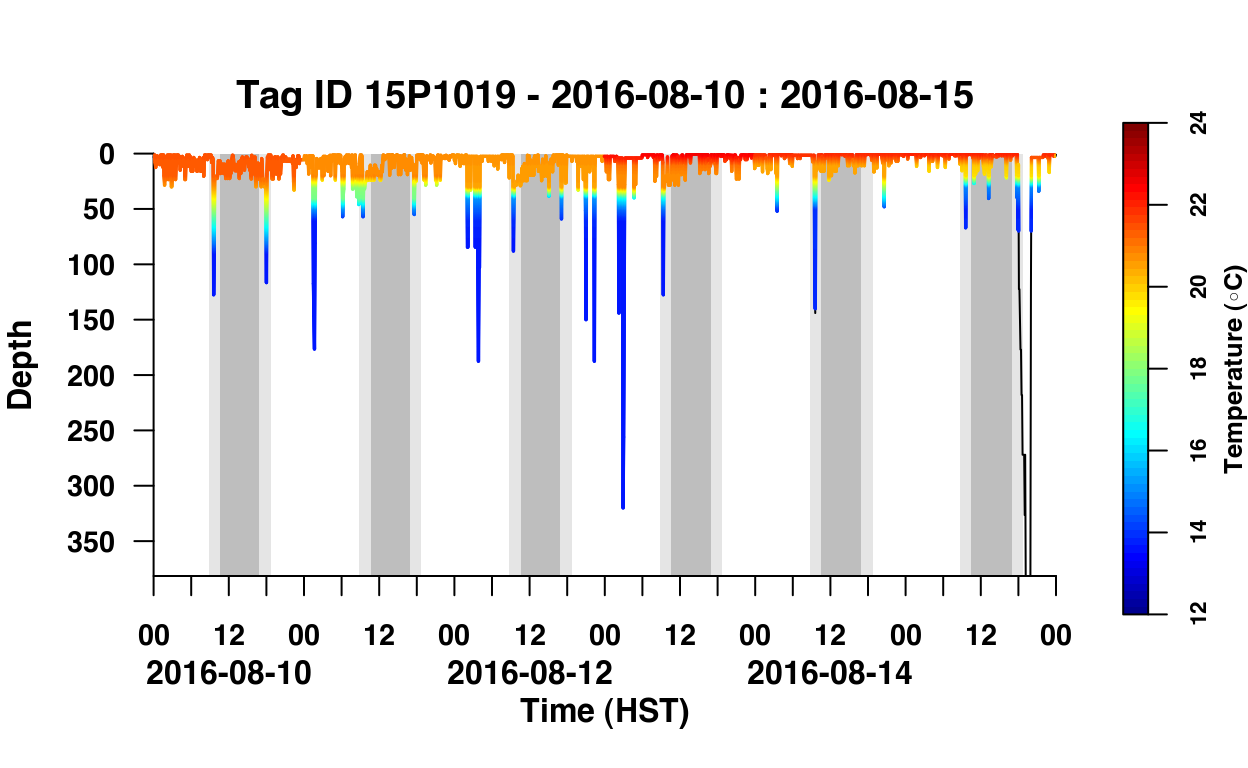
RchivalTag Tutorial | Part 5 - Visualizing data in local time/other time zones
In part 2 of the RchivalTag tutorial series, we learned already different ways to visualize depth time series data. In this tutorial, we will address how to illustrate the data in local time (other time zones).
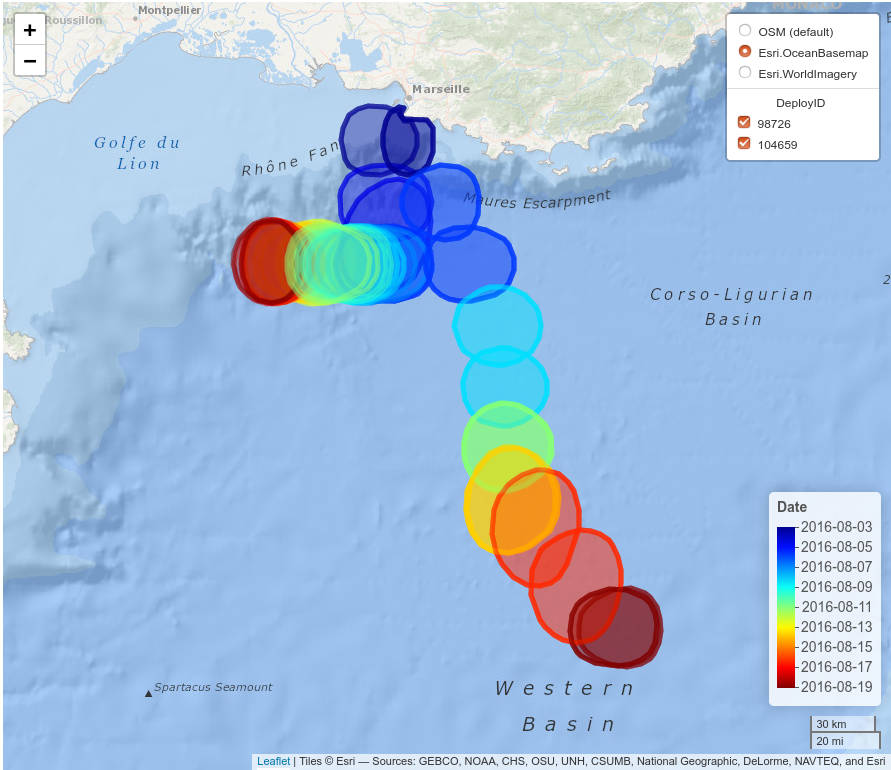
RchivalTag Tutorial | Part 4 - Geolocation Estimates and Likelihood Areas
In this fourth part of the RchivalTag tutorial series, we will learn how to explore geolocation estimates and related likelihood areas from pop-up archival tags.
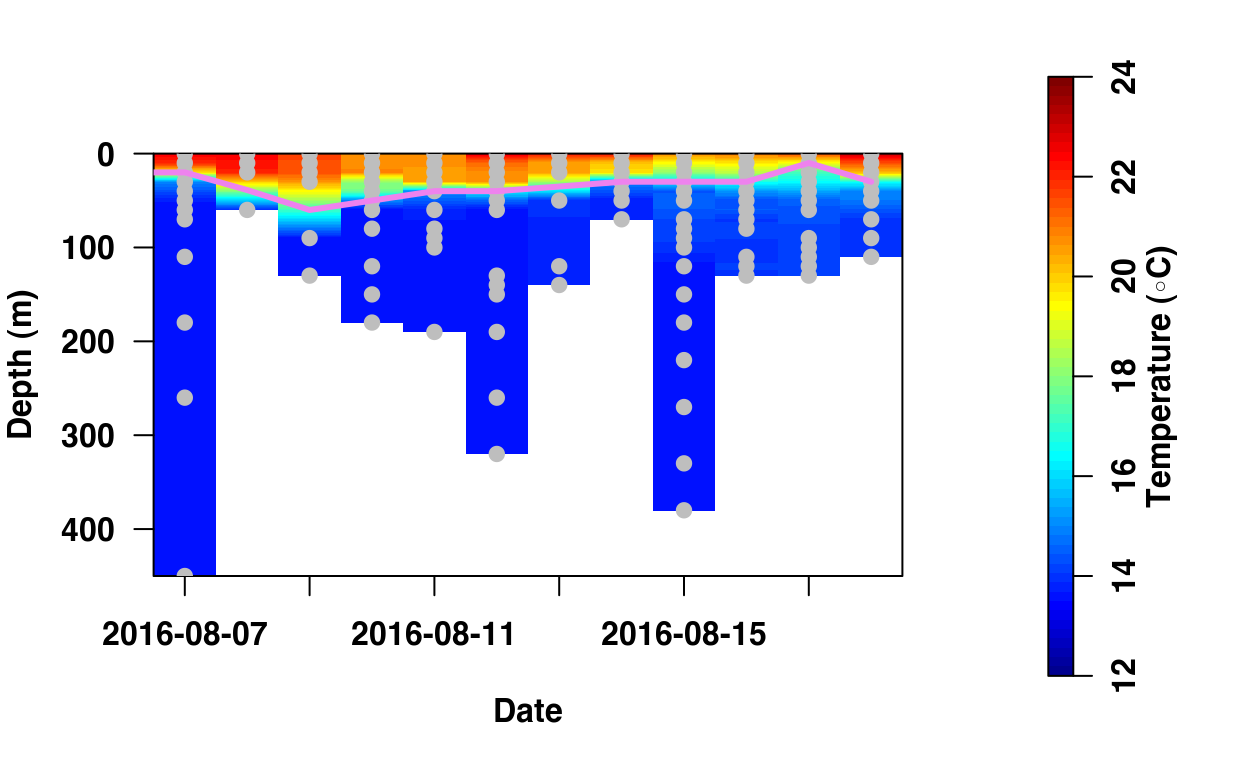
RchivalTag Tutorial | Part 3 - Daily Depth-Temperature profiles
In this third part of the RchivalTag tutorial series, we will learn how to explore PAT-Style depth temperature profiles, a special data product of (pop-up) archival tags from Wildlife Computers to analyze the thermal structure of the water column that requires far less ARGOS transmissions than temperature time series data.
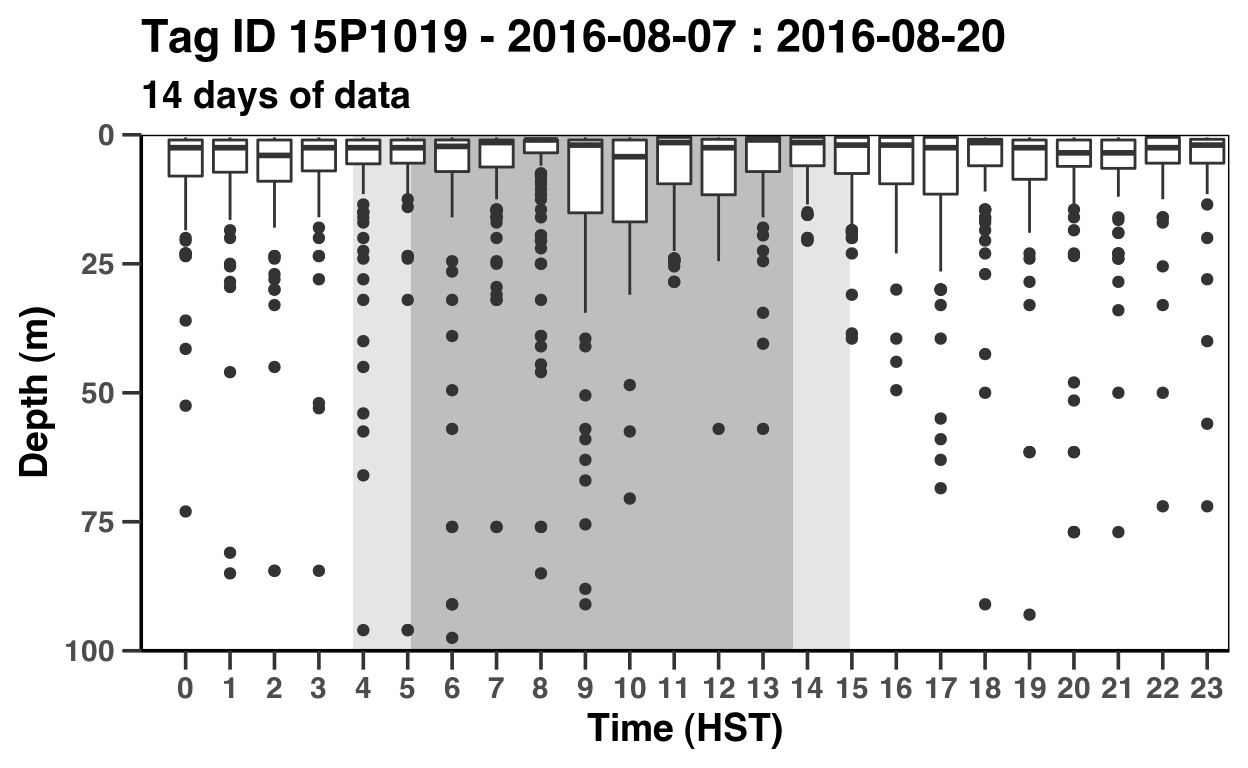
RchivalTag Tutorial | Part 2 (Interactive) Time Series Data Plots
In this second part of the RchivalTag tutorial series, we will learn how to read, analyze and visualize depth and temperature time series data.
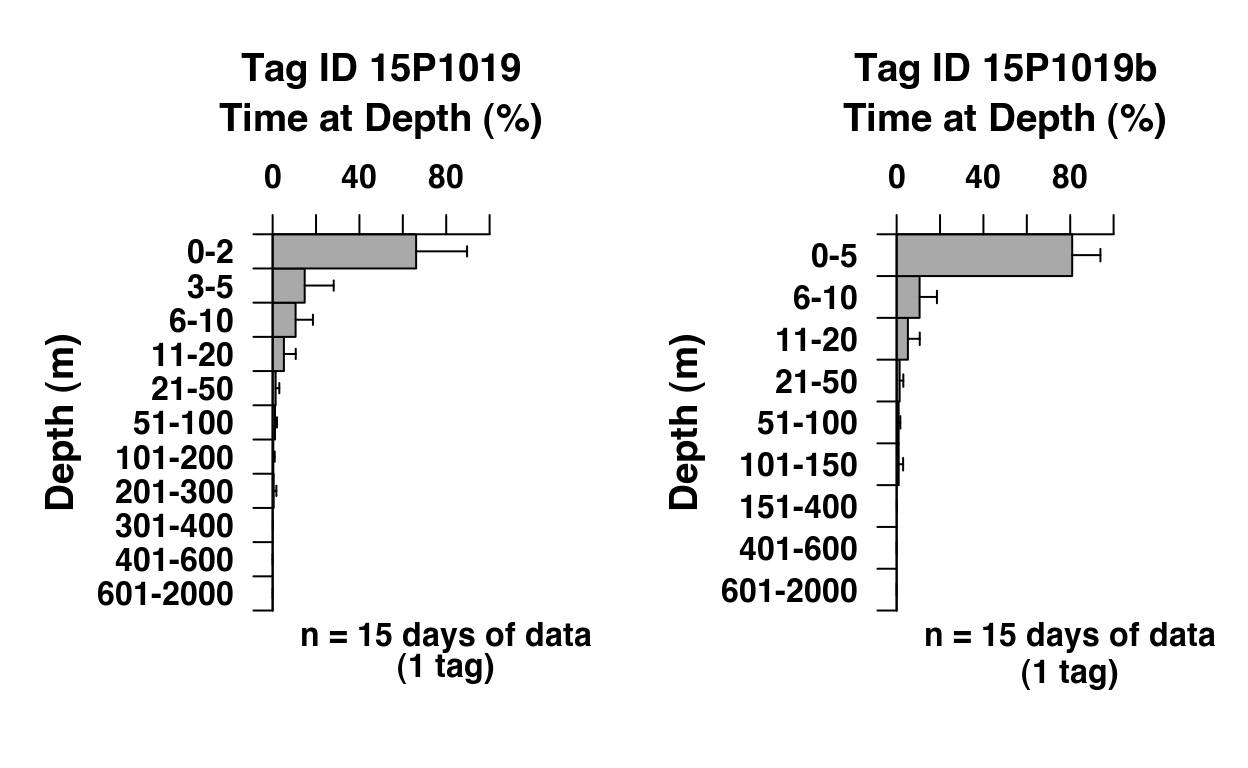
RchivalTag Tutorial | Part 1 - Time-at-Depth & Time-at-Temperature Histograms
In this first part of the RchivalTag tutorial series, we will learn how to read, merge, analyze and visualize Time-at-Depth & Time-at-Temperature frequency data.
oceanmap Tutorial | Part 2 - Visualizing and Analyzing Spatial Oceanographic Data
In this second oceanmap tutorial we will learn how to map and analyze spatial oceanographic (remote sensing) data.
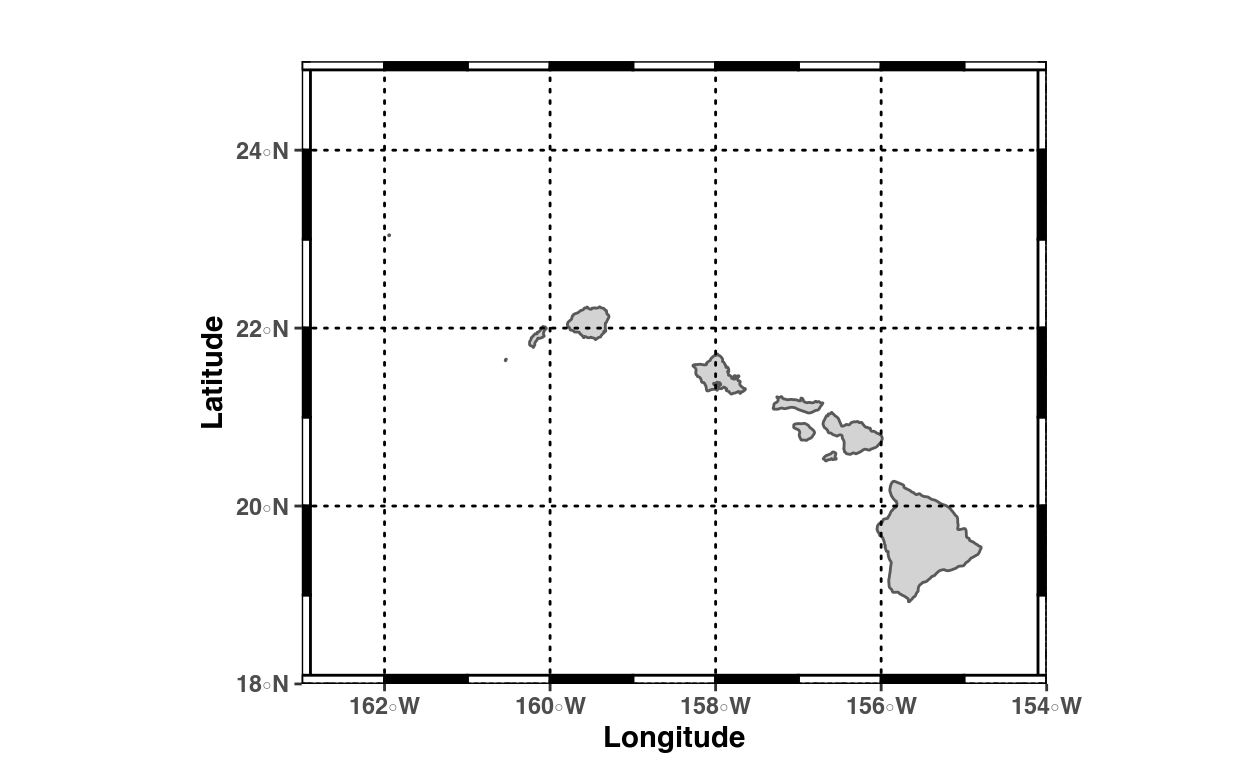
oceanmap Tutorial | Part 1 - Plotting landmasks
In this first oceanmap tutorial we will learn different ways to plot or add landmasks to existing figures.